7.4 EAST ZONE
Study population
A total of 44,165
children were registered in the rural and urban areas of eight selected
districts in the zone. Of these, 43,282 were subjected to tuberculin testing.
While tests were performed satisfactorily among 42,836 children, these
were unsatisfactory among 446 (1%) children. Among satisfactorily tested
children, 40,964 were test read. Of these 19,332 were without BCG scar,
21,085 with BCG scar and the BCG scar status was doubtful among 547 children
(Flow chart).
The proportion
of children with BCG scar among satisfactorily test read children was
51.5%. It was about 49% in rural and 60% in urban areas. This difference
was statistically significant.
The proportion
of children with BCG scar were found to vary between individual districts
and were generally higher in urban than in rural areas and among males
compared to females, as in other zones (table 7.4.1).
The analysis
for estimating prevalence of infection and ARTI was performed among 19332
satisfactorily test read children without BCG scar.
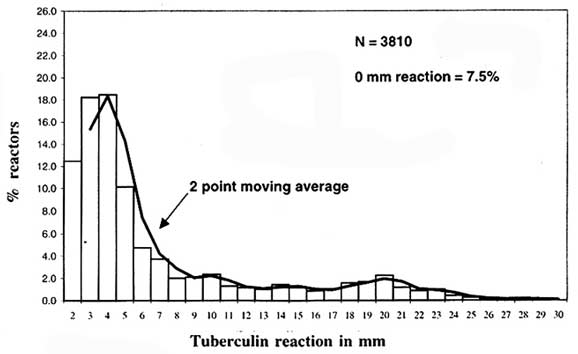
The frequency distribution of tuberculin reaction size
The frequency
distribution of tuberculin reaction sizes among children without BCG scar
in the zone as well as the rural and urban strata separately is presented
in figure 7.4.1 to 7.4.3. It was observed to be bimodal in the rural as
well as urban strata. The mode of reactions attributable to infection
with tubercle bacilli was observed at 20 mm in both the strata. There
was suggestion of an anti-mode at 16 mm in the urban stratum and 16/17
mm in the rural stratum.
Estimated prevalence of infection and ARTI
The prevalence
of infection was estimated by the antimode as well as the mode methods
adopting the following criteria:
i)
Using the cut off
point of 16 mm - all reactions > 16 mm in both strata were considered
due to infection with tubercle bacilli (Method I).
ii)
By mirror image
technique considering the mode at 20 mm (Method II).
The
prevalence of infection in the zone was estimated at 6.9% by both the
methods. The ARTI as computed was 1.3%. The confidence limits are given
in the table 7.4.2.
A
significantly higher proportion of children was found to be infected in
urban stratum compared to rural stratum, by both methods. Consequently,
the estimated ARTI was higher in urban stratum than in rural. In rural
stratum, the estimated ARTI was 1.2% by both methods. In urban stratum,
the estimated ARTI was 1.7% by Method I and 1.6% by Method II. Therefore,
the estimates by two methods were similar.
The proportion
of infected children and the estimated ARTI was found to be similar among
boys and girls (P>0.05).
The ARTI
when computed from the estimated prevalence for 5-9 year age group was
only slightly higher at 1.3% when compared to that estimated from 1-4
year age group at 1.2%.
The proportion
of infected children in the rural and urban areas of different districts
is given in appendix.
About 1% of children presented with additional features viz. vesicles and bullae.
FlowChart
Study Population - East Zone
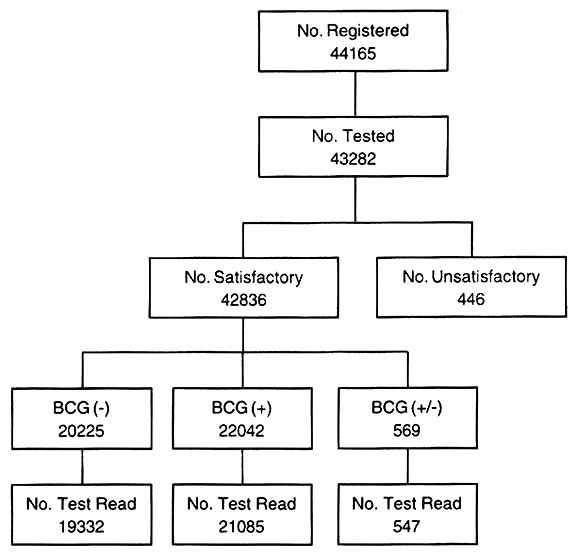
Table 7.4.1 : Proportion (%) of children (satisfactorily test read)
with BCG scar by District
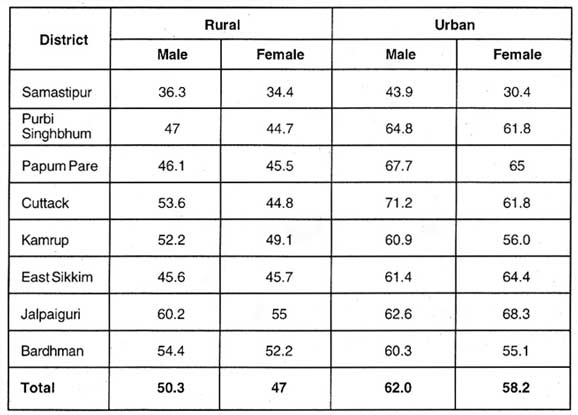
Table 7.4.2 : Prevalence of infection among children 1-9 years of age
and computedARTI- East zone
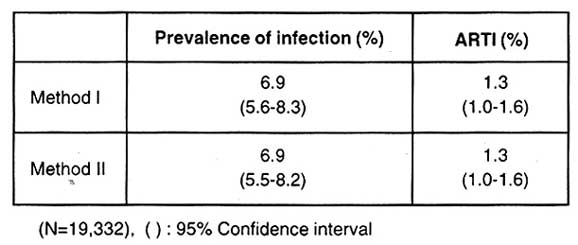
Table 7.4.3 : Prevalence of Infection and ARTI
by stratum, sex and age group
- East zone
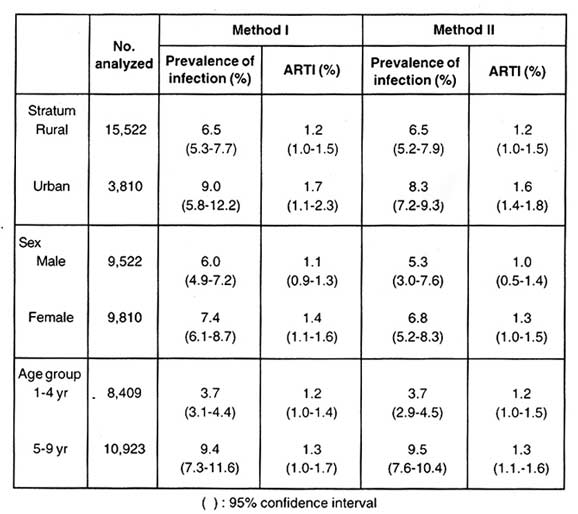
Fig. 7.4.1 : Frequency distribution of tuberculin
reaction size among
children 1-9 years of age, without BCG scar - East zone
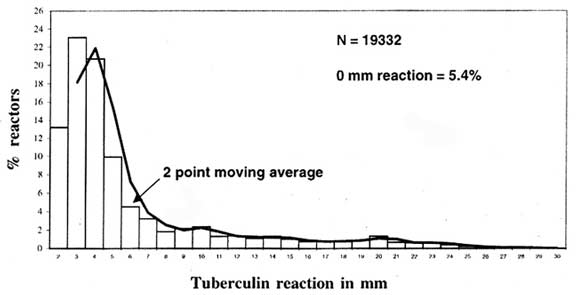
Fig. 7.4.2 :Frequencydistribution of tuberculin
reaction sizeamong
children 1-9 years of age, withoutBCGscar - rural stratum, East zone
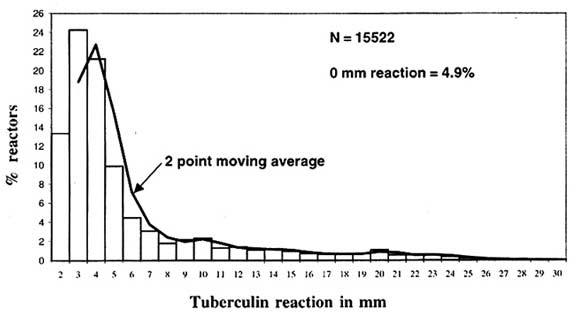
Fig. 7.4.3 :Frequency distribution of tuberculin
reaction size among
children 1-9 years of age, without BCG scar - urban stratum, East zone