7.1 North Zone
Study population
A total of 55,433 children were registered in the rural and urban areas of six selected districts in the zone. Of these, 51,705 were subjected to tuberculin testing. While tests were performed satisfactorily among 51,380 children, these were unsatisfactory among 325 (0.6%) children. Among satisfactorily tested children, 48323 were test read. Of these 25816 were without BCG scar, 21869 with BCG scar and the BCG scar status was doubtful among 638 children (Flow chart).
The proportion of children with BCG scar among satisfactorily test read children was 45.4%. It was 40.5% in rural and 61.6% in urban areas. This difference was statistically significant. The proportion of children with BCG scar were found to vary between individual districts and were very low in the three districts from the state of Uttar Pradesh. These proportions were generally found to be higher in urban than in rural areas and among males compared to females (table 7.1.1).
The analysis for estimating prevalence of infection and ARTI was performed among 25816 satisfactorily test read children without BCG scar.
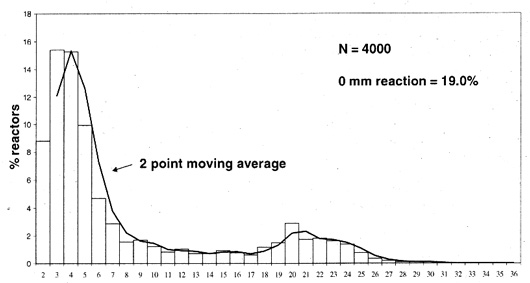
The frequency distribution of tuberculin reaction size
The frequency distribution of tuberculin reaction size among 25816 test read children without BCG scar in the zone is presented in at figure 7.1.1. It was observed to be bimodal with the mode of reactions attributable to infection with tubercle bacilli at 20 mm. There was a suggestion of an anti-mode at 14 mm. Similar distributions were observed on plotting the tuberculin reaction sizes separately for rural and urban strata (figure 7.1.2 & 7.1.3).
Estimated prevalence of infection and ARTI
The prevalence of infection was estimated by the antimode as well as the mode methods adopting the following criteria :-
i) Using the cut off point at 14 mm - all reactions > 14 mm were considered due to infection with tubercle bacilli (Method I).
ii) By mirror image technique considering the mode at 20 mm (Method II).
The prevalence of infection in the zone was estimated at 10.3% by antimode method and 10.5% by mirror image technique. The ARTI computed was 1.9% by both techniques. The confidence limits are given in the table 7.1.2.
A significantly higher proportion of children was found to be infected in urban compared to rural stratum, by both methods. Consequently, the estimated ARTI was higher in urban stratum than in rural. In rural stratum, the estimated ARTI rates were found to be similar by two methods: Method I - 1.6%, Method II - 1.5%. In urban stratum, the estimated ARTI was 2.6% by Method I and 3.3% by Method II. The higher estimate by method II in urban areas was due to the distribution of reactions around the second mode being skewed towards the right side of the mode (fig 7.1.3).
The proportion of infected children and the estimated ARTI were found to be similar among males and females.
The ARTI when computed from the estimated prevalence among 5-9 year age group was higher than that from 1-4 year age group.
About 0.8%. of children presented with additional features viz. vesicles and bullae.
The proportion of infected children in the rural and urban areas of different districts is given in section 7.6.
FlowChart
Study Population - North Zone
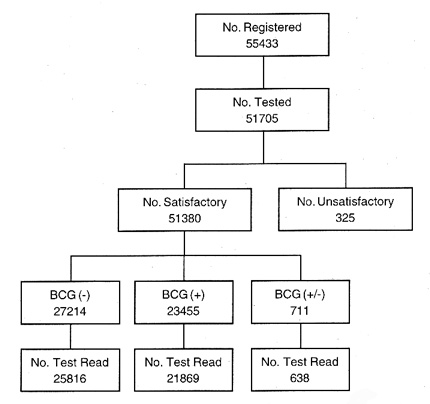
Table 7.1.1 : Proportion (%) of children (satisfactorily test read)
with BCG scar by District
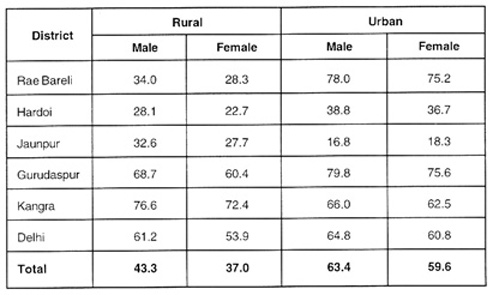
Table 7.1.2 : Prevalence of infection among children 1-9 years of age
andcomputedARTI- North zone
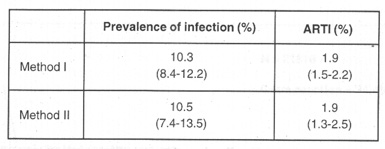
Table 7.1.3 : Prevalence of Infection and ARTI
by stratum, sex and age group
- North zone
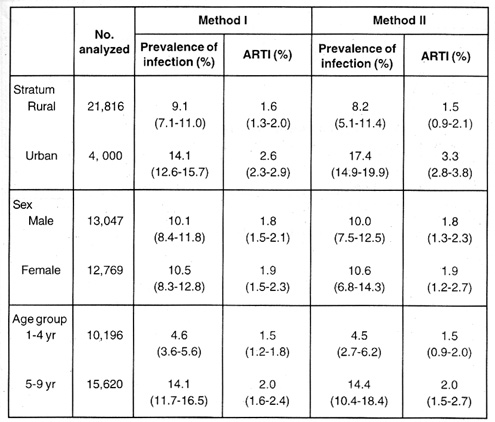
Fig. 7.1.1 : Frequency distribution of tuberculin
reaction size among
children 1-9 years of age, without BCG scar - North zone
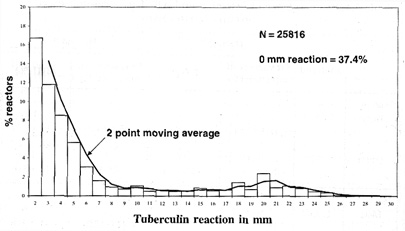
Fig. 7.1.2 :Frequencydistribution of tuberculin
reaction sizeamong
children 1-9 years of age, withoutBCGscar - rural stratum, North zone
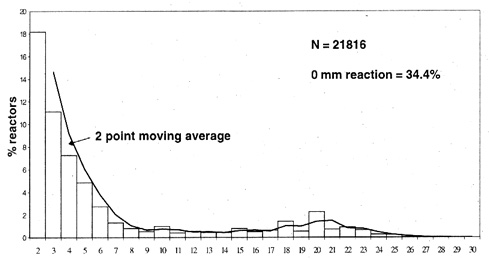
Fig. 7.1.3 :Frequencydistribution of tuberculin
reaction sizeamong
children 1-9 years of age, withoutBCGscar - urban stratum, North zone